CLIA-certified testing laboratories such as ZRT are required to provide reference ranges as an aid to interpretation of test results.
Ideally, reference ranges provide the expected range of values for a healthy population. When methodology and equipment is identical for testing a particular analyte among different laboratories, reference ranges for that analyte should be the same.
However, when methodologies or equipment for the same test differ somewhat from lab to lab, each lab must provide its own reference range established with its own methods. These ranges are usually very close, but may differ slightly depending on method. An example would be testing testosterone in blood or saliva by extraction and LC-mass spectrometry vs. direct testing by immunoassay.
Do Reference Ranges Define Normality?
Reference ranges do not always reflect a “normal” healthy population free of medications. Most laboratories establish their reference ranges from a large population of people where detailed information on health status, stage of life (premenopausal vs. postmenopausal), and medications and hormones used is unknown, and therefore not taken into account. Couple this with differences in lifestyles, physiology, dietary habits, and genetic heredity, and it’s even more difficult to define, let alone find, a normal population.
Over the past 19 years, we have filed information on over 2 million people who have tested with us. |
These variables can have profound effects on test values used to establish a “normal” reference range. For example, in women using topical progesterone, salivary levels of progesterone can rise to levels much higher (500-5000 pg/mL) than what is seen at the peak of luteal phase 100-200 pg/mL. When these subjects are included into range determinations, it results in a very broad reference range that clinically has less meaning to a woman NOT using exogenous progesterone.
To truly establish a “normal” reference range for a given analyte (hormone) it is essential to know that the subject has very few, if any, symptoms of hormonal imbalance, and is not using exogenous hormones or medications to treat a condition. To do that the lab needs to test a large number of healthy people from all walks of life, deem them to be “normal,” and call the range of results obtained a “normal” range.
ZRT collects and stores in our database information on gender, menopausal status, hormones and medications used as well as symptoms associated with specific hormonal imbalances. Over the past 19 years, we have filed information on over 2 million people who have tested with us. With this information, we are able to establish truly “normal” ranges by filtering out subjects using hormones or medications and suffering from hormone-related symptoms. It has also allowed us to establish age- and gender-related reference ranges in healthy subjects who were experiencing few or no symptoms/conditions.
Clinically Useful Ranges – Published Data
For some lab tests, ranges reflect clinical targets based on meta-analyses of large, published studies of disease risk. In these cases, an “optimal” cutoff is recommended, or the range might simply be “less than” or “greater than” a certain number that has been established as a clinical target that people should achieve that reflects a healthy population.
ZRT follows stringent protocols for assay validation and verification using multiple controls and known standards. |
For example, ZRT’s reference range for HDL cholesterol is “≥ 40 mg/dL,” which is an optimum range recommended by the National Cholesterol Education Program (NCEP). Similar ranges have been established based on large scale clinical studies for cardiometabolic risk markers (blood lipids, HbA1c, insulin) as well as thyroid hormones such as TSH.
Published reference range values for these analytes are more clinically useful when interpreting test results than a reference range based on a much smaller population tested by the lab. However, even among the academic circles these reference ranges may have limitations and be controversial, such as the reference range cutoff for high TSH, which was once 9, dropped to 4.5, is now recommended at 3 by some, and others argue should be 2 or less [1].
In order to use published ranges, the lab’s results must correlate well with known standards for each test to ensure that results correspond to those from other labs and can therefore be compared to national recommendations. This is certainly the case for reference ranges established at ZRT that conform with national standards.
ZRT follows stringent protocols for assay validation and verification using multiple controls and known standards, and participates in proficiency testing using samples provided by:
- College of American Pathologists (CAP)
- NY State Department of Health
- Vitamin D External Quality Assessment Scheme (DEQAS)
- Ensuring the Quality of Urinary Iodine procedures (EQUIP).
Because ZRT has developed unique and innovative sample collection methods, our assay validation for blood spot testing involves correlation with standard serum testing for each test, while dried urine tests are validated against equivalent liquid urine samples.
Clinically Useful Ranges – Laboratory Data
For some tests, such as saliva steroid hormone tests, no nationally established, published ranges exist. In these cases, laboratories usually establish their own reference ranges based on their testing populations, i.e., the people whose samples come in for testing.
By definition, the testing population is comprised of people concerned about their health; they are therefore, in the main, more likely to have hormonal issues than not. Without knowing what the conditions (patient age, menopausal status, symptoms, hormones and medications used) it is very difficult to establish an accurate hormone reference range that reflects a “normal and healthy” population.
To eliminate abnormal results at either end of the range spectrum, the values between the 5th and 95th percentiles of the range usually comprise the reference range. |
To make the reference range as normal as possible, labs make reasonable attempts to exclude values from people who are not healthy. This can be done on the basis of excluding data from subjects with certain disease states such as diabetes, heart disease, or cancer. But these parameters are usually unknown and, in addition, data related to patients’ symptoms of hormonal imbalances, medications, and hormonal therapies that can profoundly affect analyte test values is usually also an unknown and therefore not filtered out of the calculations for ranges. This results in very broad and less clinically meaningful reference ranges.
Usually, to eliminate abnormal results at either end of the range spectrum after initial filtering of the data, the values between the 5th and 95th percentiles of the range of results comprise the reference range. In some cases, where a larger proportion of the testing population is likely to be abnormal, the reference range is based on the 20th to 80th percentile of the results.
ZRT, therefore, relies on the tens of thousands of test results obtained from the testing population over many years, and filters them to exclude obvious disease states, hormone users, and symptoms commonly associated with high or low test values for the analyte of interest. After this filtering, the spread of values (reference range) between which most testers fall is established, eliminating the outlying values at the top and bottom ends of the range.

The testing population is also sorted according to gender and menopausal status, and ranges are established for each of these subgroups. We also look at test results according to type and dosages of hormone supplementation, and provide supplementation ranges for those where we have established predictable values based on testing of large numbers of hormone users.
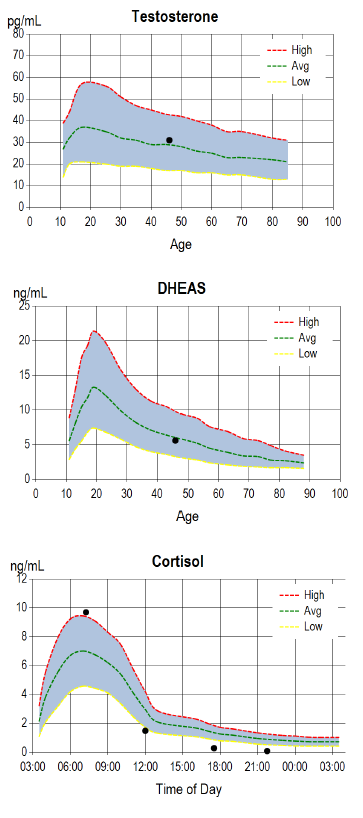
For analytes that vary in a predictable way with age, e.g., DHEA-S and testosterone, test results are plotted on the known reference ranges at each age group. For cortisol, which varies with time of day, a graph shows test results plotted on a true 24-hr graph according to the actual time the sample was collected, as opposed to plotting test values on a graph only showing morning, noon, evening, and night collections. In the examples of our test report graphs shown on the right, the reference range is the shaded area, and the test result is the black dot.
We also determine our own reference ranges for dried urine tests for metabolites and elements, based on our testing population and using appropriate cut-offs to eliminate outliers. In the case of elements testing, for example, people with unusually high dietary exposure to certain elements, e.g., iodine, have abnormally high urinary levels and are excluded from the reference range. Ranges are sometimes adjusted, especially for newer tests, as the testing population expands and more values are available in the database on which to base the reference range.
Related Resources
- Blog: A Year of Saliva in Research
- Blog: Cortisol Testing in Saliva, Blood Spot & Urine
- ZRT Test Specifications (validation data)
- ZRT Reference Range Documents
References
[1] Garber JR, et al; American Association of Clinical Endocrinologists and American Thyroid Association Taskforce on Hypothyroidism in Adults. Clinical practice guidelines for hypothyroidism in adults: cosponsored by the American Association of Clinical Endocrinologists and the American Thyroid Association. Endocr Pract. 2012;18:988-1028.
